
Let get started now!
Let get familar with the canvas first.
Let create a free accout and login. A dashboard with sample project will be shown. Press the '1. Get Started'.
You may also need some sample data to import. Let download it in "https://github.com/lky2431/simplot/tree/main/sample_data"
You can see that the screen is divided into two section. The left bigger part is node based editor. The right part is chart preview.
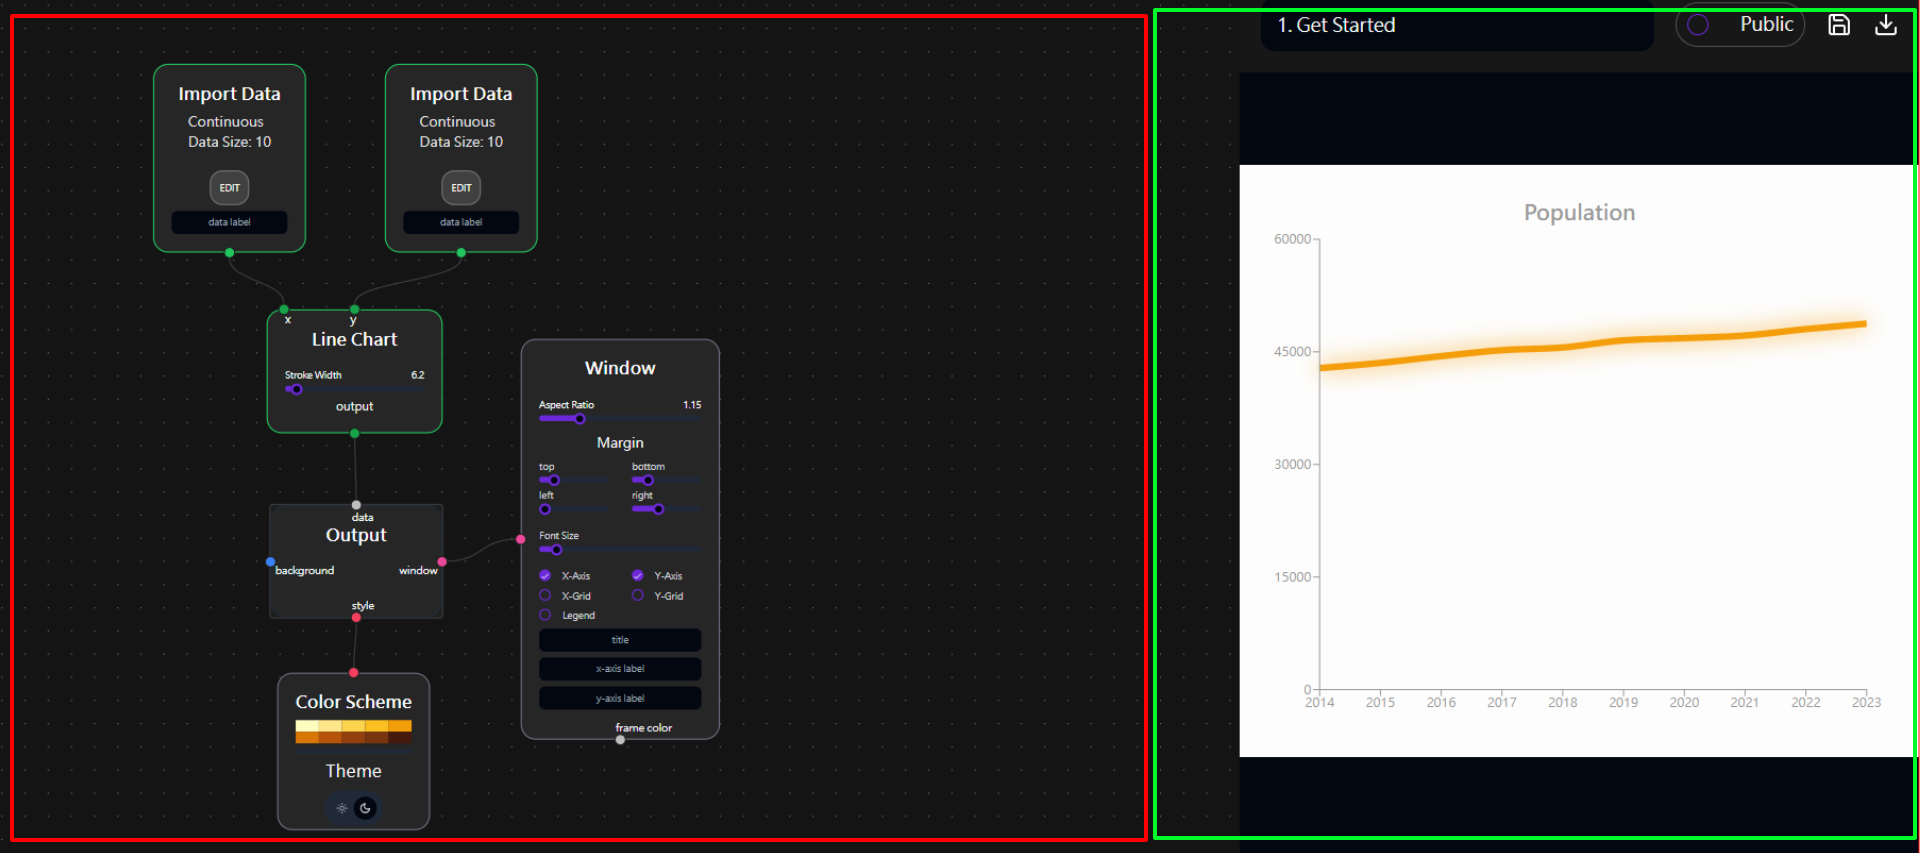
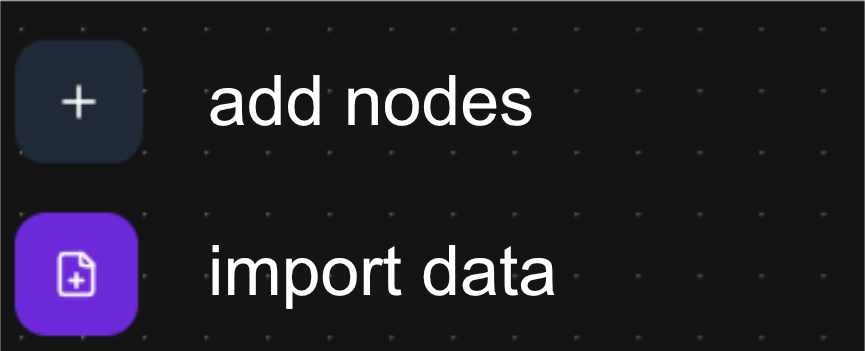
You can see two small button in left bottom corner. The upper one is button to add node. The another one is data import.
Data import
Press the data import button. Import a 'pollution.csv' file.
In the canvas, find two import data node. If the node is missing, it can be added. Press the edit button. A window will be pop up. Select the polluton.csv
In one import data node, point your mouse at A1 cell. Press left button and holding it and moving to A10 cell. The column A will be selected. Close the window.
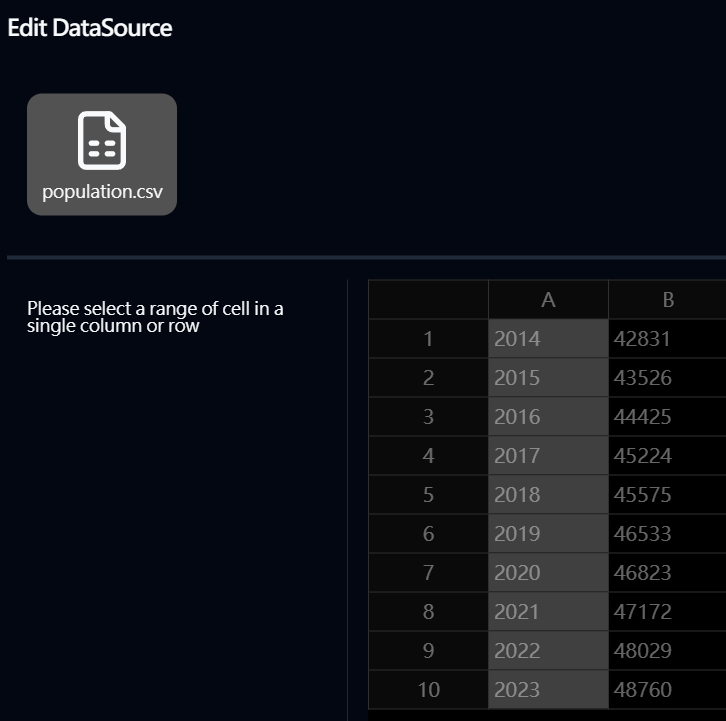
In the other node, perform the same to select column B.
Connect to Chart
Find or add a line chart node. Connect the handle of first import data node to the x handle of line chart node and then connect the other import data node to the y handle.
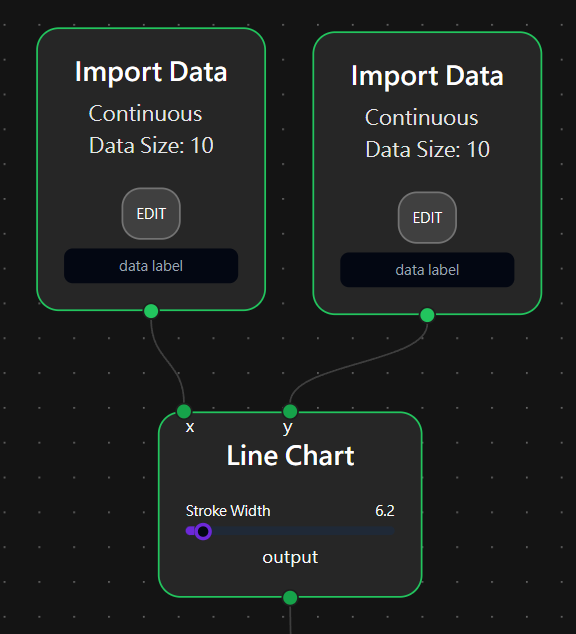
The y handle only accept continuous data. A warning should be shown if the first import data node is tried to connect to line chart node.
Final output
Connect the output handle of line chart node to the output node. You can see a chart being plotted in the preview window.
Move the slider on the line chart node. The preview line chart response in real time.
Press the save button in top right corner to save your project. Press the download button to get the chart as an image.
Congratulation!. This is the first chart you plot with Simplot. Let continue to know how to configure the style.