
Welcome to Simplot
Simplot is aimed to provide you new experince in chart plotting by node based editor.
In this tutorial, you will learn how to use Simplot to plot chart. The concept will be discussed first.
Node
Every element in Simplot is node. The node contain some property and attribute the control the output.
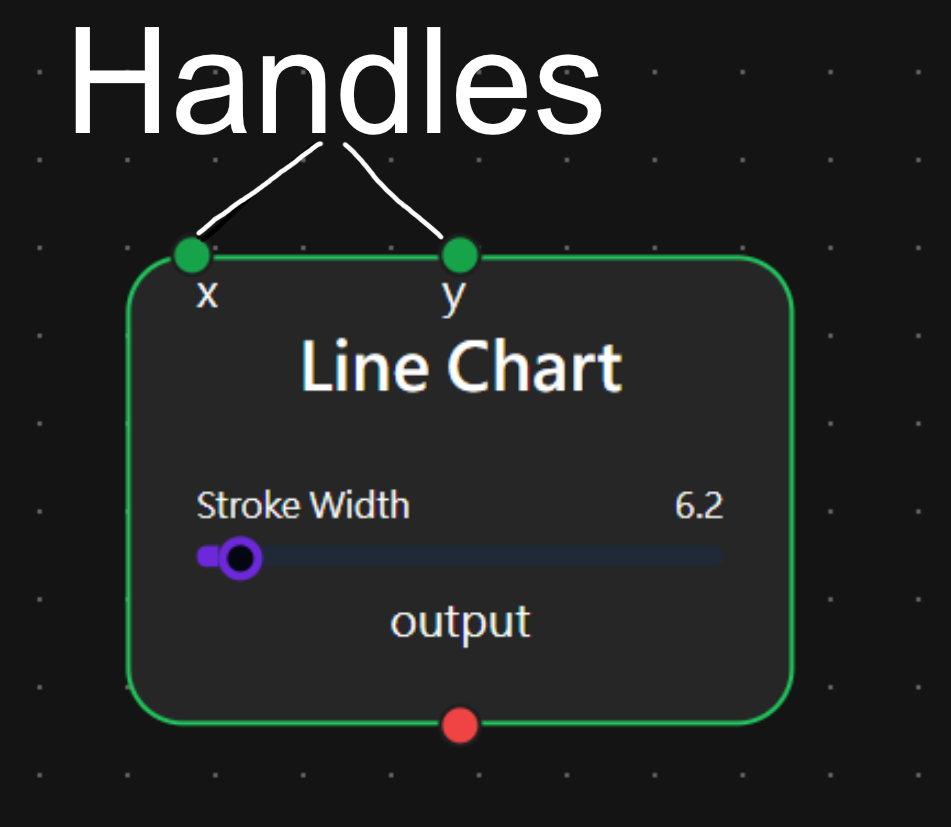
The node will have some handle. The handle is used to connect with other node. Some handle can only be used to connect to other node. Some handle can only be connected to. Every handle will have its property and they can only be connected to other handle with the same property. You will learn the property in other tutorial.
The attribute and data of the node will also be connected when the node is connected to form a final output.
The node can be drag to adjust its position. You can select a node and then press the "Back" key on your keyboard to delete it.
Key Element
Every Chart should have the following element
1. Data
What to be display?
2. Plot
How to organiza the data? Bar chart? Line chart? Pie chart?
3. Style
The final look of the chart
Every node can be used must be one of these three type
Dataset type
A dataset can be either continuous data or categorical data
Continuous Data
can take on any value within a defined range and is often measured on a continuous scale, such as weight, height, or temperature.
Categorical Data
consists of discrete values that fall into distinct categories or groups, such as gender, ethnicity, or product types.
The type of dataset affect the final chart and connection of chart. Simplot can automatically determine whether a dataset is continuous or categorical